Mapping Fundamental‐Mode Site Periods and Amplifications from Thick Sediments: An Example from the Jackson Purchase Region of Western Kentucky, Central United States

Abstract
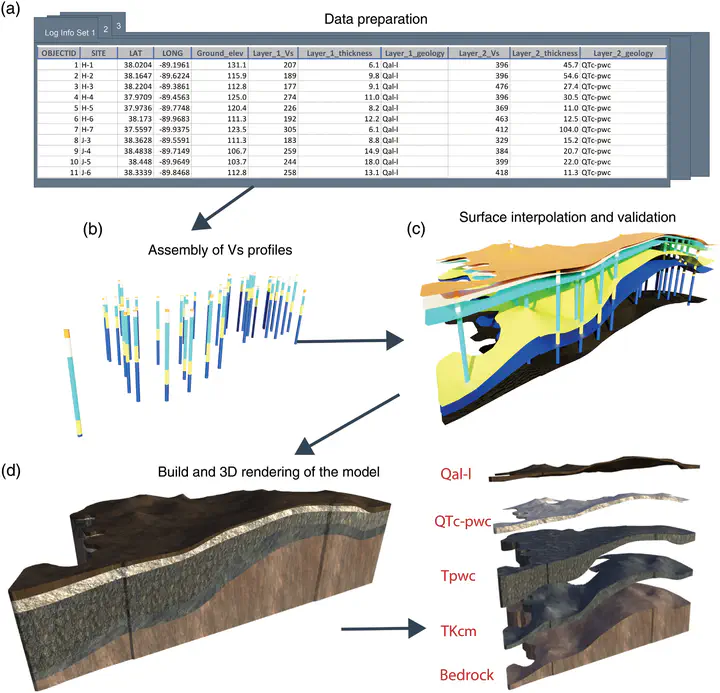
VS30 is currently used as a key proxy to parameterize site response in engineering design and other applications. However, it has been found that VS30 is not an appropriate proxy, because it does not reliably correlate with site response. Therefore, the VS30‐based National Earthquake Hazards Reduction Program site maps may not capture regional site responses. In earthquake engineering, site resonance, which can be characterized by the fundamental mode with a site period (Tf) and its associated peak amplification (A0), is the primary site‐response concern. Mapping Tf and A0 is thus essential for accurate regional seismic hazard assessment. We developed a 3D shear‐wave velocity model for the Jackson Purchase Region of western Kentucky, based on shear‐wave velocity profiles interpreted from seismic reflections and refractions, mapped geologic units, and digital‐elevation‐model datasets. We generated shear‐wave velocity profiles at grid points with 500 m spacing from the 3D model and performed 1D linear site‐response analyses to obtain Tf and A0, which we then used to construct contour maps for the study area. Our results show that Tf and A0 maps correlate with the characteristics of regional geology in terms of sediment thicknesses and their average shear‐wave velocities. We also observed a strong dependency of A0 on bedrock shear‐wave velocities. The mapped Tf and A0 are consistent with those estimated from borehole transfer functions and horizontal‐to‐vertical spectral ratio analyses at broadband and strong‐motion stations in the study area. Our analyses also demonstrate that the depth to bedrock (Zb) is correlated to Tf, and the average sediment shear‐wave velocity (VS‐avg) is correlated to A0. This implies that Zb and VS‐avg may be considered as paired proxies to parameterize site resonance in the linear‐elastic regime.