Using landslide-inventory mapping for a combined bagged-trees and logistic-regression approach to determining landslide susceptibility in eastern Kentucky, USA

Abstract
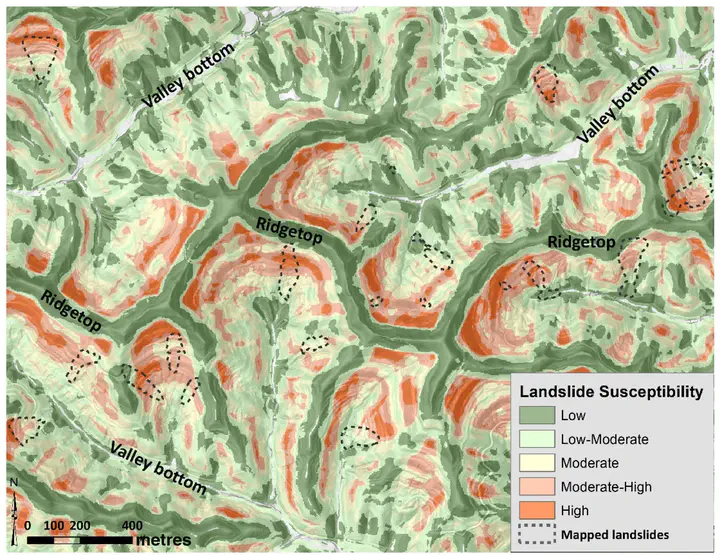
High-resolution LiDAR-derived datasets from a 1.5 m digital elevation model and a detailed landslide inventory (n ≥ 1000) for Magoffin County, Kentucky, USA were used to develop a combined machine-learning and statistical approach to improve geomorphic-based landslide-susceptibility mapping. An initial dataset of 36 variables was compiled to investigate the connection between slope morphology and landslide occurrence. Bagged trees, a machine-learning random-forest classifier, was used to evaluate the geomorphic variables, and 12 were identified as important standard deviation of plan curvature, standard deviation of elevation, sum of plan curvature, minimum slope, mean plan curvature, range of elevation, sum of roughness, mean curvature, sum of curvature, mean roughness, minimum curvature and standard deviation of curvature. These variables were further evaluated using logistic regression to determine the probability of landslide occurrence and then used to create a landslide-susceptibility map. The performance of the logistic-regression model was evaluated by the receiver operating characteristic curve, area under the curve, which was 0.83. Standard deviations from the probability mean were used to set landslide-susceptibility classifications low (0–0.10), low–moderate (0.11–0.27), moderate (0.28–0.44), moderate–high (0.45–0.61) and high (0.62–1.0). Logistic-regression results were validated by using a separate landslide inventory for the neighbouring Prestonsburg 7.5-minute quadrangle, and running the same regression function. Results indicate that 74.9% of the landslide deposits were identified as having moderate, moderate–high or high landslide susceptibility. Combining inventory mapping with statistical modelling identified important geomorphic variables and produced a useful approach to landslide-susceptibility mapping.